User Guide
1 Regional Insights
1.1 Multi-countries

Choose the view of comparison between multi-countries or single countries.
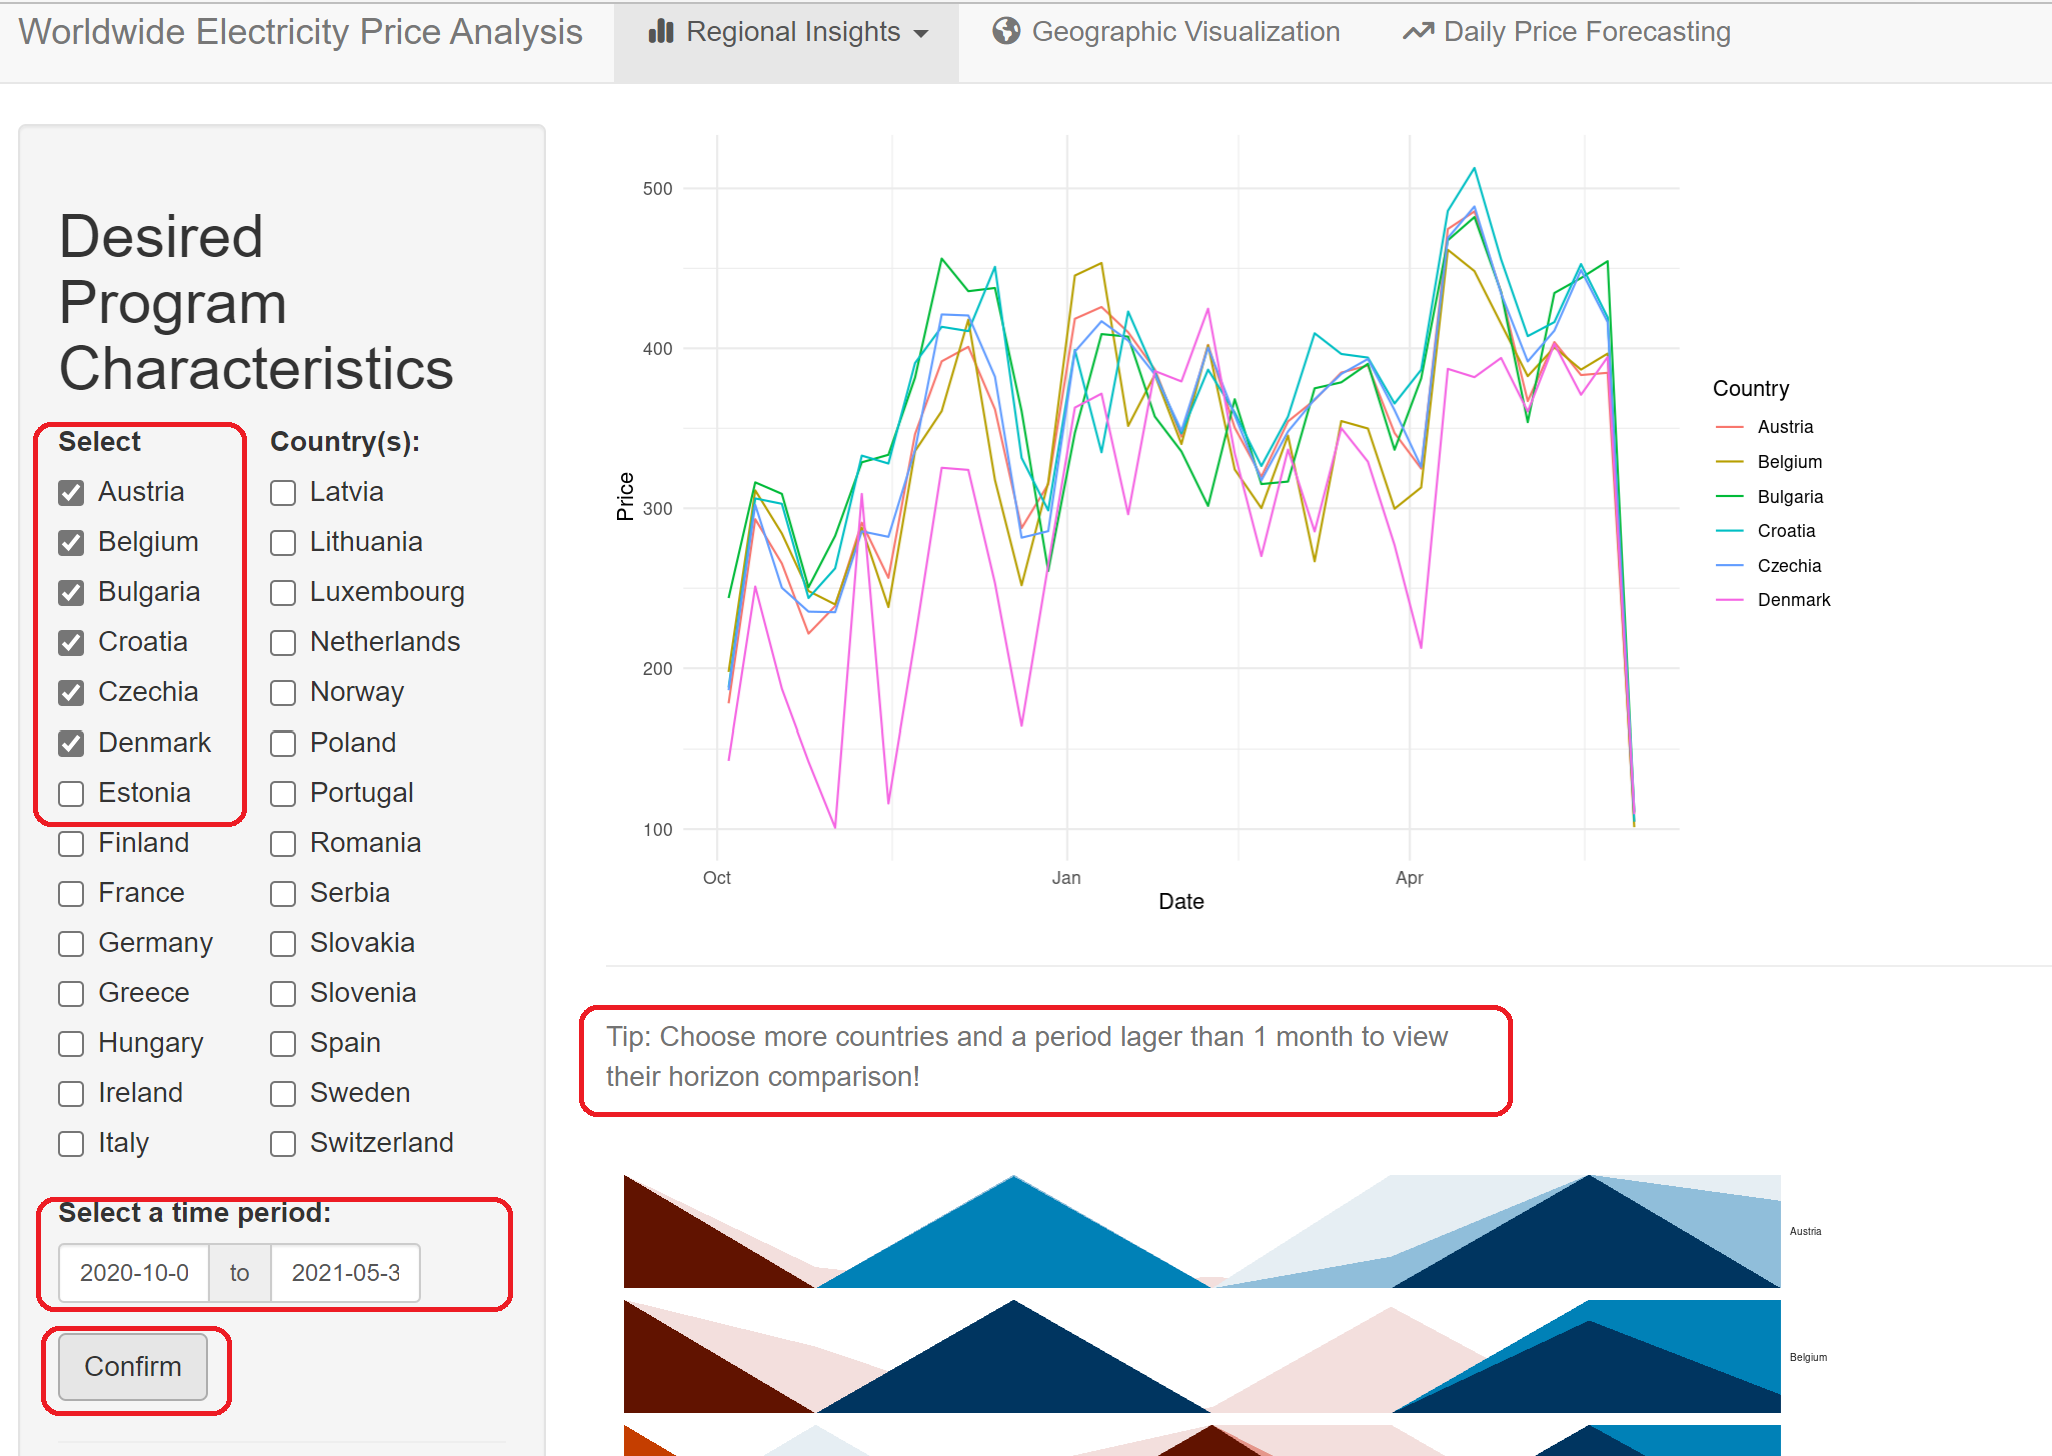
Check the wanted countries and choose a period (the period should more than one month), then click on ‘Confirm’.
1.2 Single Country
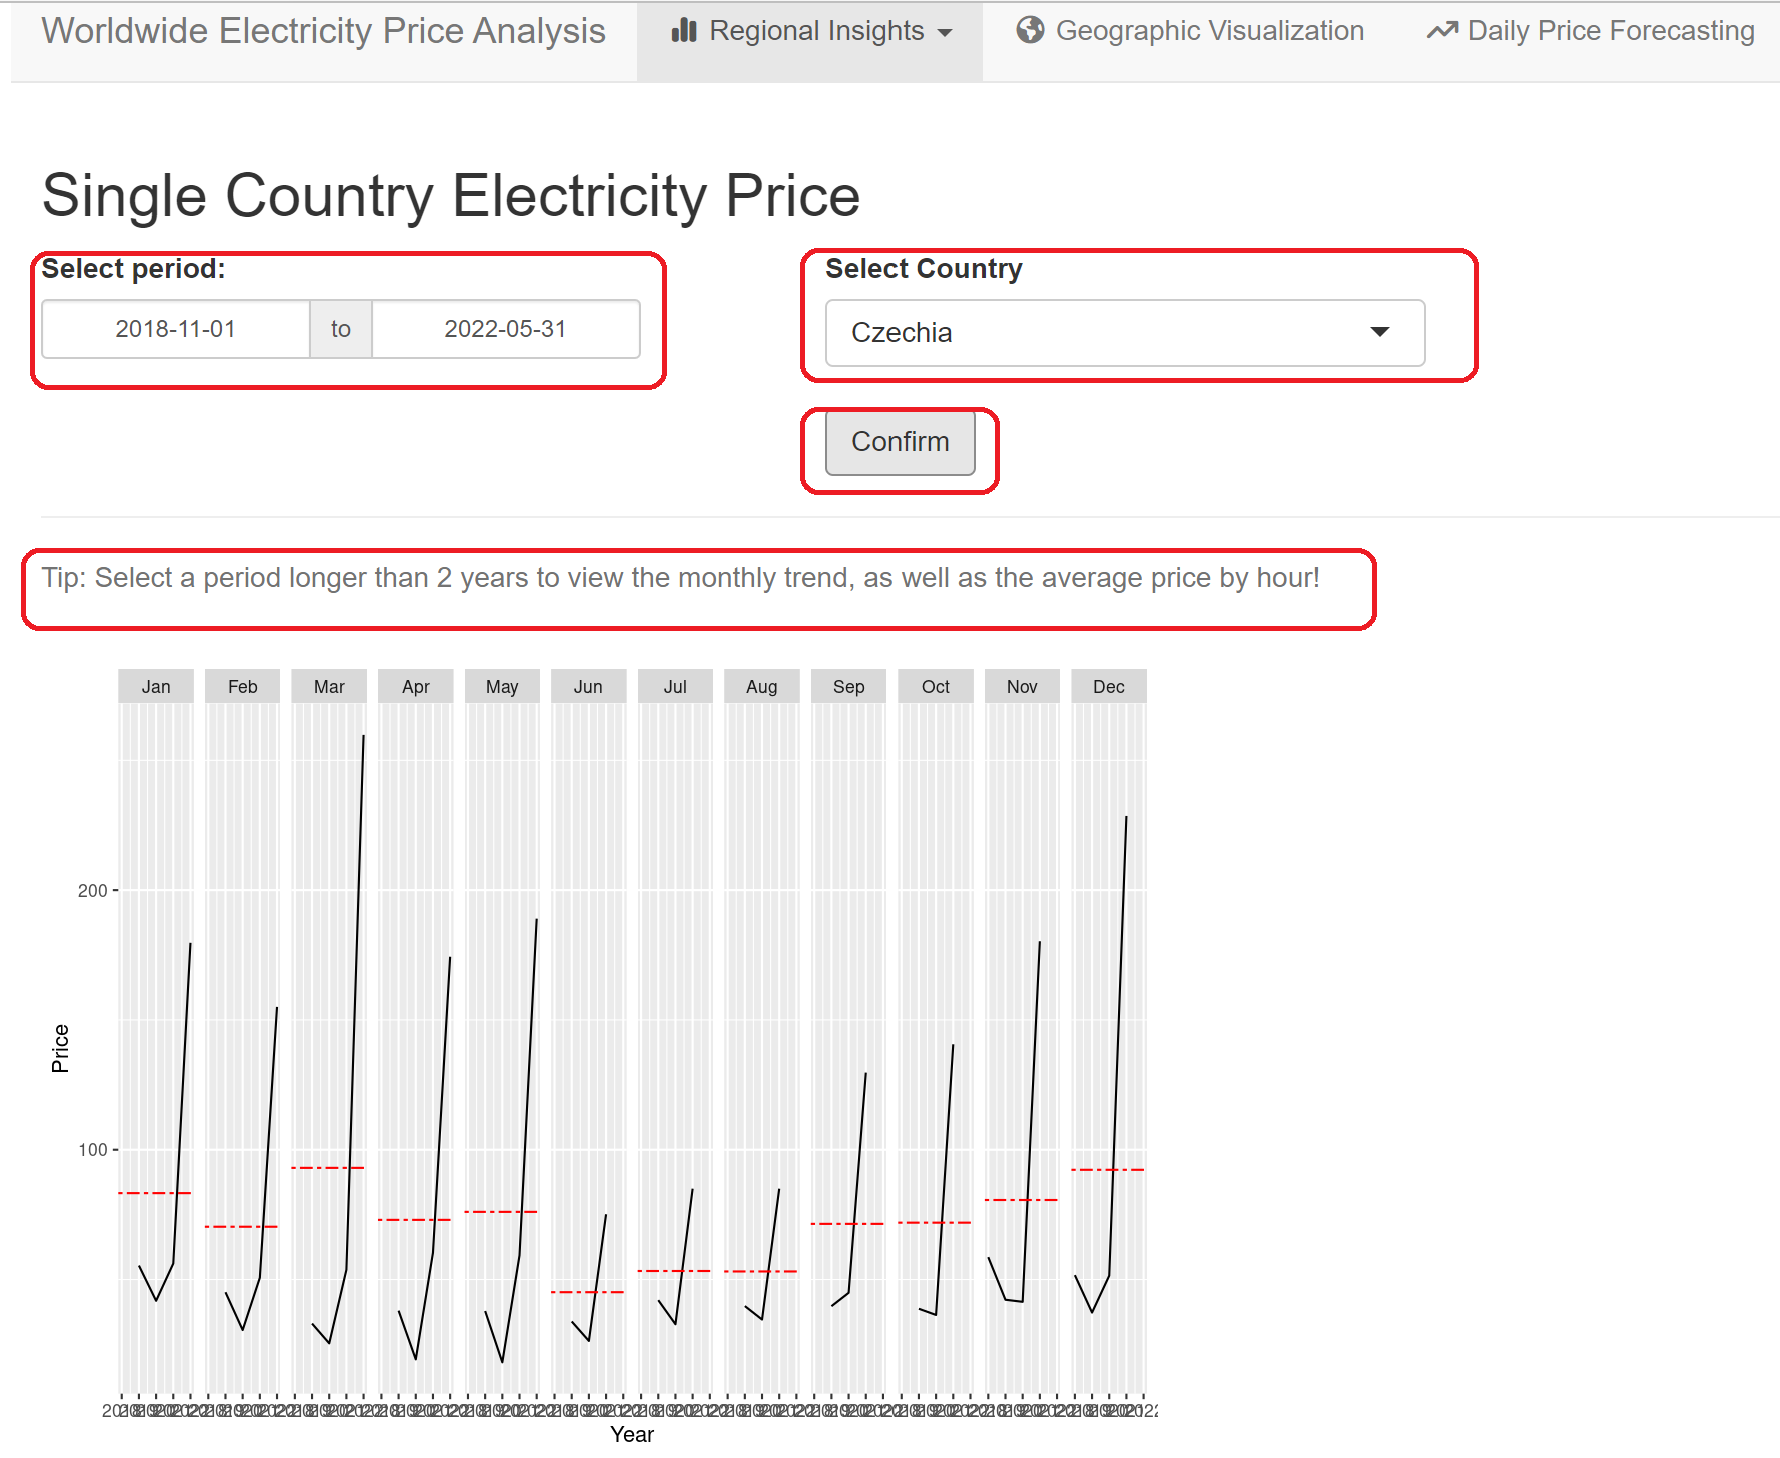
Choose a single country and choose a period (the period should more than two years), then click on ‘Confirm’.
2 Geographic Visual
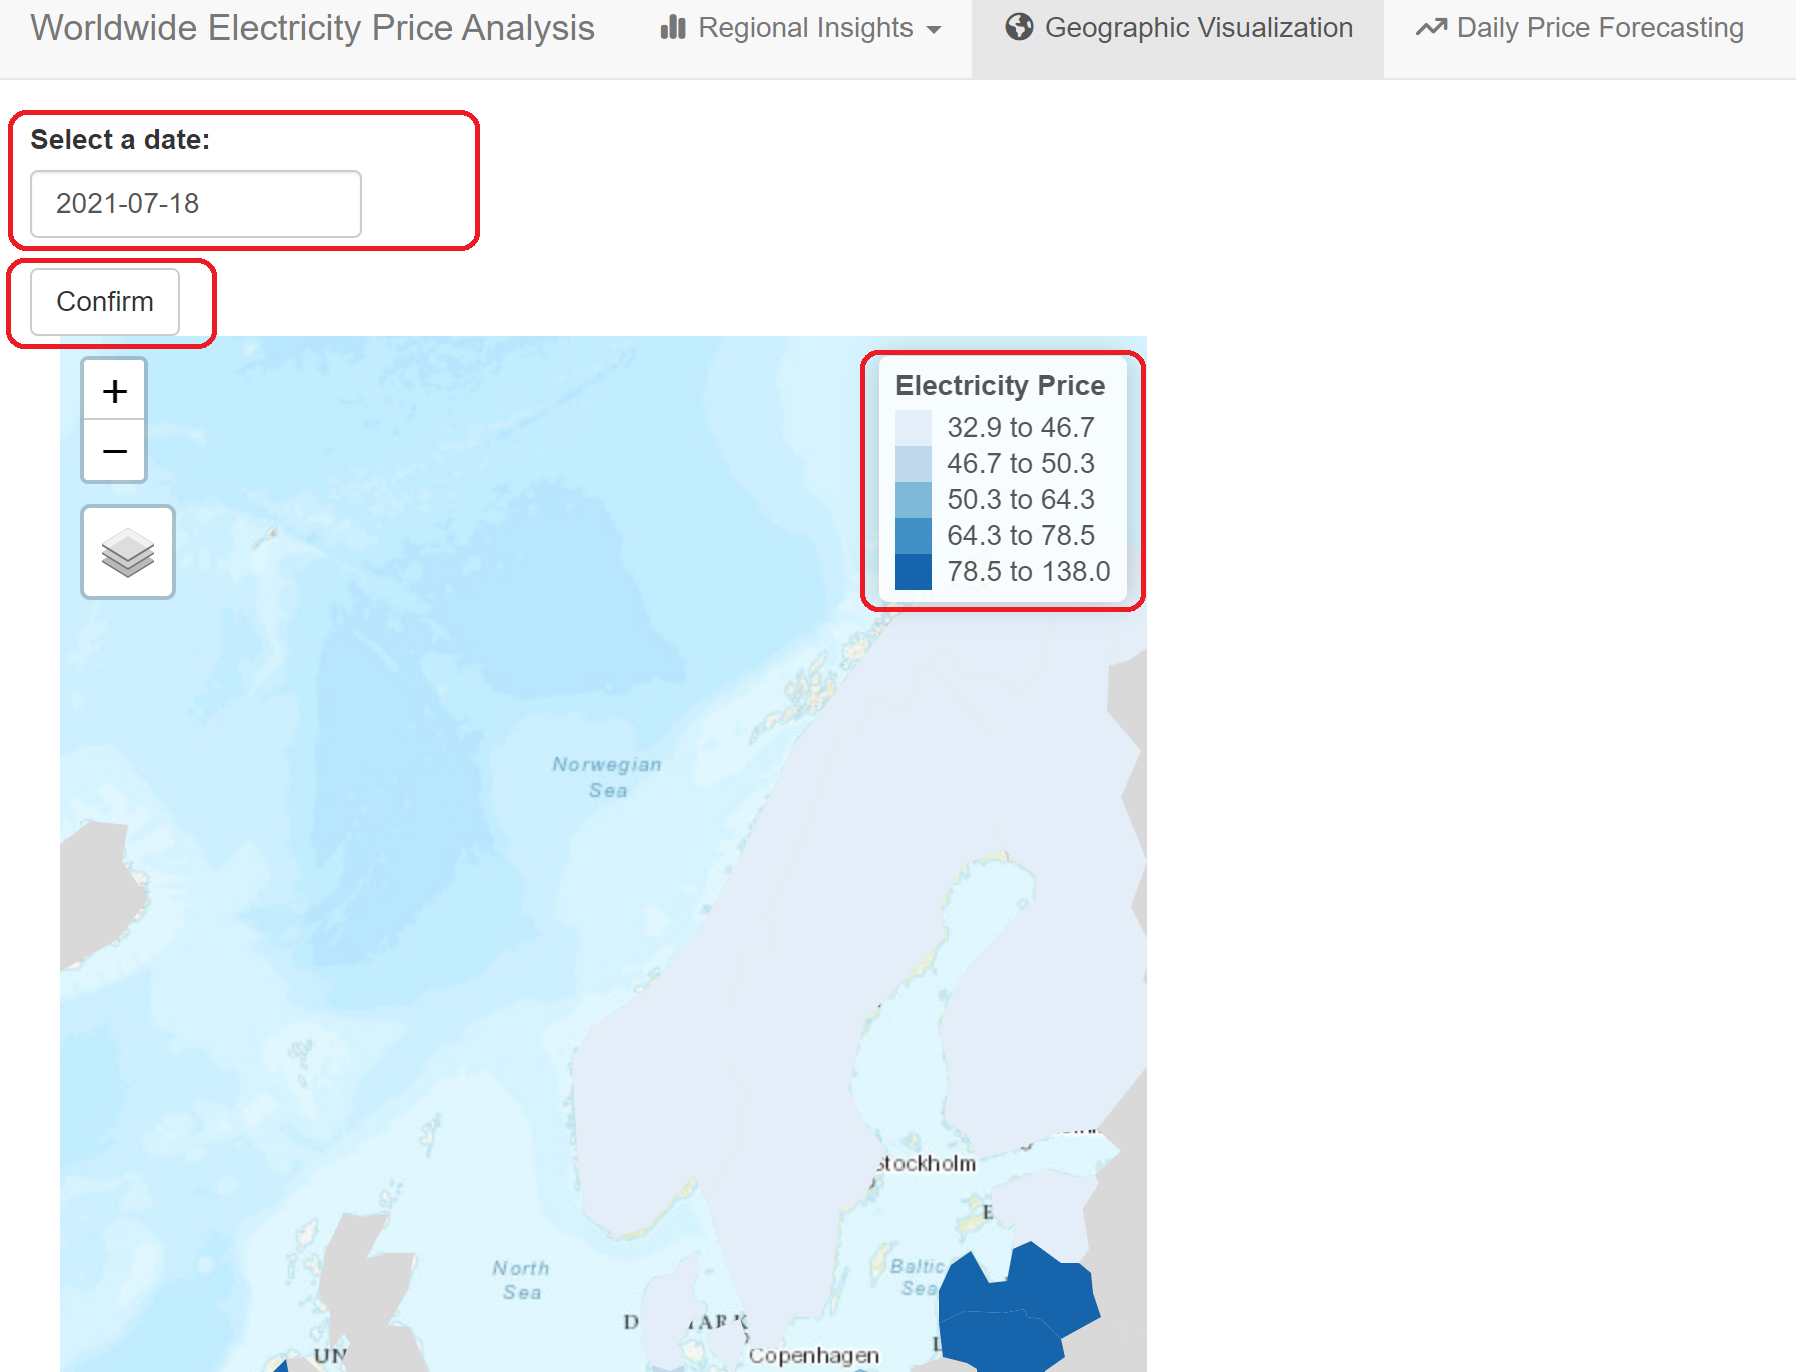
Choose a exact data and click on ‘Confirm’, the distribution of electricity prices will be represented by different colors in the map of Europe.
3 Forecasting
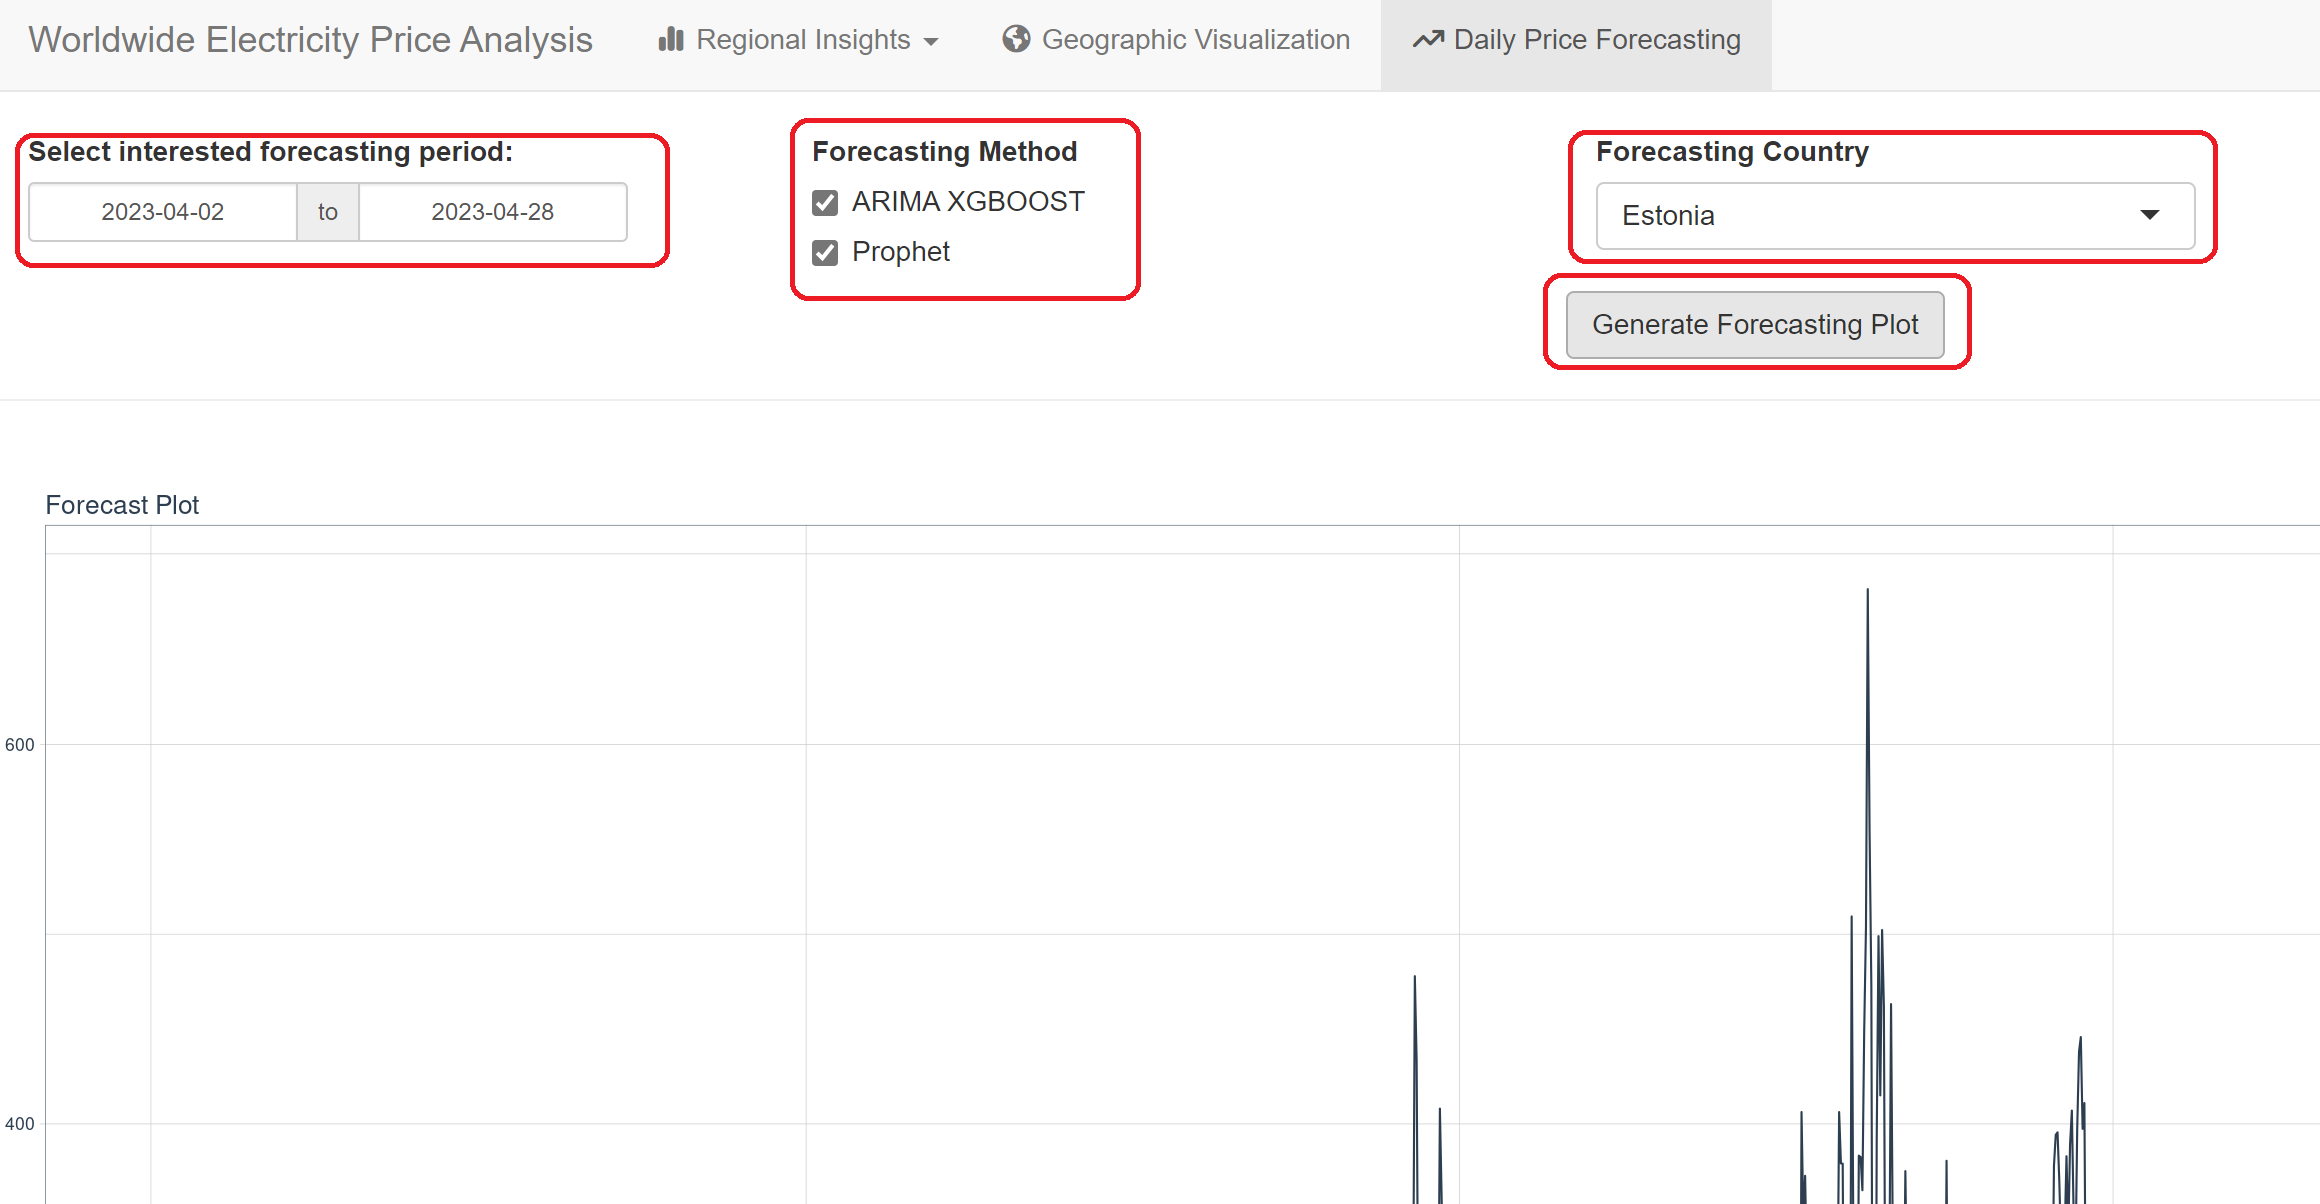
Checking the box to choose a preferred forecasting method, select the interesting future period and country, then click on”Generate Forecasting Plot”.